2024. 11. 26. 05:23ㆍtime-series
A Survey of Explainable Artificial Intelligence (XAI) in Financial Time Series Forecasting
PIERRE-DANIEL ARSENAULT and SHENGRUI WANG, Université de Sherbrooke, Canada JEAN-MARC PATENAUDE, Laplace Insights, Canada
주요 개념 : 해석가능성interpretability (inherent understandability) 과 설명력 explainability (requiring additional methods)
1. Interpretable Models : inherently transparent and allow users to understand their decision-making processes
• Linear Models: Simple algorithms like linear regression where feature coefficients directly indicate their contribution to the output.
• Decision Trees: Provide a clear sequence of rules that explain predictions, making them intuitive for non-experts.

2. Explainable Models
• SHAP and LIME: Techniques that approximate the model’s behavior locally by evaluating feature importance for specific predictions.
• Visual Explanations: Tools such as heatmaps and feature visualizations that help users interpret model focus and outputs.

3. Feature Importance : how much each feature impacts the model’s predictions.
• ✨Global: Evaluates a feature’s overall contribution across a dataset.
• Local: Assesses a feature’s influence on a single prediction, enabling detailed analysis of specific outcomes.
4. Decision Rules : Decision rules are conditions derived from interpretable models or learned within explainable models to clarify decision-making:
• Rule-Based Systems: Use structured logic or fuzzy systems to establish transparent rules.
• Derived Rules: Transform complex models (e.g., GRUs) into interpretable decision trees that approximate their logic.
5. Trends and Visual Representations
• ✨Trend Decomposition: Separates long-term trends from short-term volatility for deeper insights.
• Visualization: Dashboards, graphs, and other tools provide intuitive representations of model focus and predictions.
Methodology
5.1 Feature and Time Importance
How to assess and explain the influence of features and time periods on financial predictions. This concept is crucial for understanding which variables a model prioritizes and how it processes temporal information in time series data.
O Feature importance measures the effect of individual features on model predictions, either globally (across the dataset) or locally (for specific predictions). It is visualized using heatmaps, bar plots, or line graphs, providing insights into both input features and internal learned representations. This transparency is especially valuable in financial analysis, where 모델이 인간 분석가가 데이터를 평가하는 방식을 모방하도록 models mimic the weighting process that human analysts apply to market data.
1) Linear Regression Models
Linear regression is inherently interpretable due to its simple structure, where coefficients directly represent feature contributions. However, financial time series are too complex for basic linear models. Instead, enhanced approaches integrate linear regression into more sophisticated models:
• 적응형 선형 회귀Adaptive Linear Regression: Coefficients change over time, offering dynamic interpretability. For example,. This allows local feature importance analysis for each firm’s financial data. 계수가 시간에 따라 동적으로 변화.
예를 들어,
• Adaptive Master-Slave(AMS) 모델(Figure 2)은 그래프 신경망(마스터)과 각 회사에 맞춘 선형 회귀 모델(슬레이브)을 결합하여 the Adaptive Master-Slave (AMS) model (Figure 2) combines a graph neural network (master) with linear regression models (slaves) tailored for individual companies 각 회사 데이터에 대한 지역적 특성 중요도를 분석. Each slave regression model is tailored to a specific company’s data, enabling local feature importance analysis.
AMS predicts unexpected company revenues by identifying the most relevant financial features for each firm. The graph neural network master adjusts the weights dynamically, enhancing interpretability while maintaining accuracy.
• 의미적 경로 모델 Semantic Path Models: 입력 데이터를 “부정적 전망”과 같은 해석 가능한 잠재 공간에 투영한 후, 이를 선형 결합하여 거시경제 지표 예측 These models project inputs into interpretable latent spaces (e.g., “negative outlook”) and use linear combinations to forecast macroeconomic indicators. The latent dimensions provide insights into the influence of textual information like news sentiment.
• Feuerriegel and Gordon [32]: This study used semantic path models to forecast macroeconomic indicators by projecting textual inputs into latent dimensions like “economic uncertainty” and “negative outlook.” These interpretable dimensions directly influence predictions, allowing insights into how news sentiment impacts variables like inflation and unemployment.
2) Decision Trees
Decision trees are a cornerstone of feature importance analysis due to their structured decision-making process.
• Fuzzy Decision Trees: Introduce fuzzy logic to capture uncertainties in financial data, improving the granularity of feature importance rankings. For example, technical indicators like RSI or moving averages can be ranked for their predictive power. 금융 데이터의 불확실성을 포착하기 위해 퍼지 로직을 도입하여 특성 중요도 순위를 세분화합니다. 예를 들어, RSI나 이동 평균과 같은 기술 지표는 예측 능력에 따라 순위가 매겨질 수 있습니다
• Silva et al. [35]: Introduced the Fuzzy Decision Tree-Fuzzy Time Series (FDT-FTS) to predict IBOVESPA stock index movements. Important features like RSI (Relative Strength Index) and moving averages were ranked using information gain during tree induction.
• Gain-Based Importance: Decision tree nodes calculate information gain, which reflects the reduction in uncertainty achieved by splitting on a particular feature. This metric provides both global and local insights into feature importance, aiding in explainability.
3) Attention Mechanisms
identify and visualize the relative importance of input features and time steps.
Attention mechanisms, widely used in neural networks, allow models to focus on relevant parts of the input data, providing insights into both feature and time importance.
• Temporal and Feature Importance: These mechanisms, often integrated into LSTMs, provide two-dimensional attention weights that 특정 예측에 가장 중요한 특성과 시간 구간 강조 highlight the most critical features and time periods for a prediction.
• An attention-based LSTM (AT-LSTM) (Figure 3) predicts stock prices 입력 특성에 가중치를 부여한 후 LSTM에 입력하여 예측을 수행 by weighting features before feeding them into an LSTM. This enhances interpretability by showing how the model prioritizes different inputs. 이를 통해 모델이 다양한 입력을 우선적으로 처리하는 방식 을 확인할 수 있음
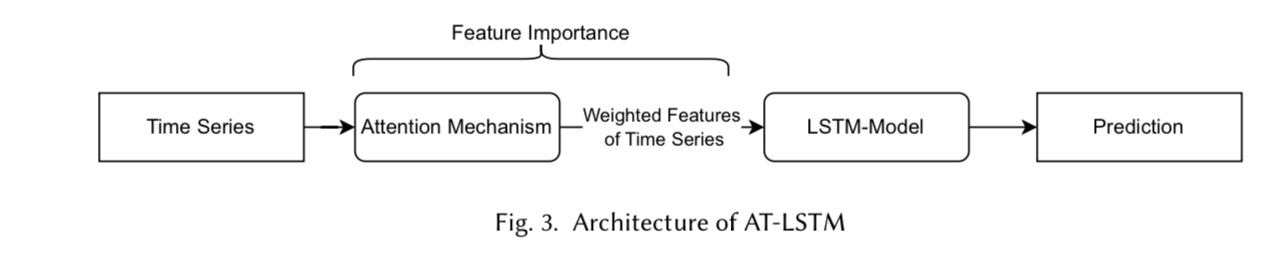
Figure 3 illustrates the AT-LSTM architecture, which introduces an attention layer before the LSTM. This layer assigns importance scores to input features before feeding them into the LSTM, making it clear how the model prioritizes different variables.
Example: In NASDAQ 100 predictions, attention weights highlighted the influence of key companies during volatile market periods, revealing the temporal and feature-specific dynamics of the model’s predictions.
• 다중 모달 어텐션: 복잡한 금융 상황에서 시계열 데이터, 뉴스, 이벤트와 같은 다양한 데이터를 통합하고, 상황에 따라 어떤 정보가 중요한지를 밝혀냅니다. 예를 들어, 시장 변동성이 높은 시기에는 뉴스가 더 중요한 반면, 안정적인 시기에는 가격 데이터가 더 중요할 수 있습니다.
4) Fuzzy Logic
Fuzzy logic models extend interpretability by quantifying feature importance through membership and hesitation values.
퍼지 로직은 애매하거나 불명확한 데이터를 처리할 때 유용하며, 숫자 데이터를 인간이 이해할 수 있는 규칙으로 변환합니다.
Fuzzy logic enhances interpretability by converting numerical inputs into linguistic rules and quantifying uncertainty.
• Intuitionistic Fuzzy Logic: Measures feature importance by analyzing changes in hesitation when features are masked. For example, masking a critical feature increases hesitation, revealing its impact on predictions.
• Membership values quantify the influence of a feature on a predicted outcome (e.g., stock rise), while hesitation captures prediction uncertainty. These metrics provide a nuanced view of feature importance, aiding in decision-making.
• Layered Design: 전문가 지식 또는 학습된 규칙을 사용해 투명한 의사결정을 생성하며, 해석 가능성과 정확성을 동시에 충족 The Interpretable Intuitionistic Fuzzy Inference (IIFI) model has multiple layers (input, fuzzification, encoding, etc.), each contributing to transparent decision-making.
• Example: In the Interpretable Intuitionistic Fuzzy Inference Model (IIFI), hesitation increases when an important feature is masked, signaling its relevance to the prediction.
5) Graph-Based Models
Graphs encode relationships between entities such as stocks, news, and market indicators, making them powerful tools for feature importance analysis in financial modeling
• Graph Representations : Nodes represent features (e.g., key terms in financial news), while edges indicate relationships (e.g., co-occurrence in articles). Centrality and connectivity metrics are used to assess feature importance. Centrality metrics, like node degree, measure the importance of each feature within the graph.
• Example: Graph-based models can integrate multiple modalities, such as news and stock prices. Feuerriegel et al. [32] used graphs to identify influential keywords like “pessimism” and “economic uncertainty” in financial texts, linking them to macroeconomic outcomes.
• Graph Neural Networks : In Multi-Modality Graph Neural Networks (MAGNN), this model integrates multiple data types (e.g., price, news, and events) and uses inter-modality attention to highlight the relevance of each data source under different conditions. For example, news may dominate predictions during volatile markets, while historical prices are more influential during stability.
6) Masks in Deep Models
Masking techniques in deep learning architectures identify feature and time importance directly within the model structure.
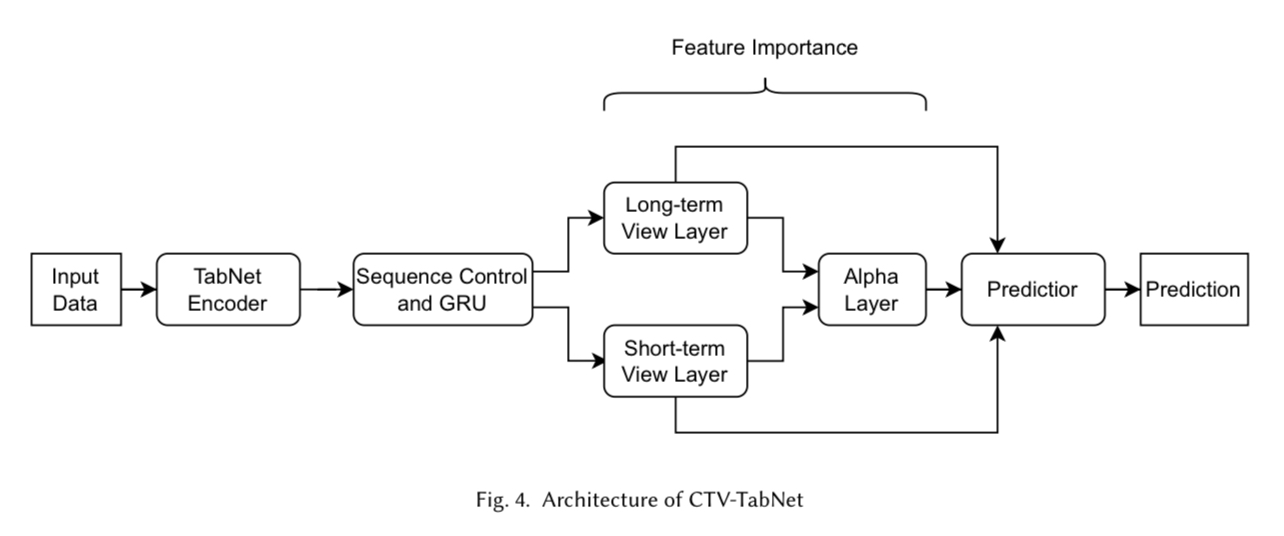
• Example: The Combined Time-View TabNet (CTV-TabNet) model (Figure 4) uses masks to assess the importance of short-term and long-term views in stock movement predictions. Figure 4 shows the architecture of CTV-TabNet, which separates inputs into short-term and long-term views. Masks are applied to evaluate the relative importance of these views and the features within them, providing a comprehensive understanding of the model’s focus. Feature importance is extracted from these masks for further analysis.
7) Hybrid Techniques
Combining multiple methods often yields more robust feature importance estimates.
• Genetic Algorithms with Decision Trees : Enhance tree-based models by selecting optimal feature subsets, improving both accuracy and interpretability.
• Example: Feature importance derived from optimized decision trees revealed the predictive power of internal (e.g., stock prices) and external features (e.g., industry trends).
• Feature Grouping: Aggregating similar features into clusters simplifies the interpretation, especially when individual features are numerous or lack financial
• Feature Aggregation : Grouping features into clusters based on financial themes (e.g., “volatility” or “momentum”) simplifies interpretation and aligns it with domain knowledge.
5.2 Decision Rules
1) Decision Trees
Decision trees are a cornerstone of interpretable AI because they visually and mathematically express their decision processes. Each node in the tree represents a decision criterion, and branches reflect possible outcomes. This design makes decision trees ideal for rule extraction and model interpretability.
Key Features of Decision Trees
1. Transparency: Clear paths from input features to output predictions allow users to trace and understand decisions.
2. Feature Importance: Nodes often compute metrics like information gain or Gini index to identify significant features, aiding in interpretation.
Advantages
• Decision trees naturally align with human reasoning due to their rule-based structure.
• They are adaptable to various data types (e.g., numerical, textual) and scales.
Applications in Financial Time Series
• GRU-Tree Model: A GRU-Tree combines gated recurrent units (GRUs) with decision trees for interpretable forecasting. The GRU first processes time series data, and its predictions are approximated using a decision tree.
• Example: The GRU-Tree has been applied to stock price movements, with extracted rules revealing financial patterns like mean reversion.
ㄴ 정확도 Fidelity: The model measures fidelity (alignment between GRU and tree outputs), often achieving scores above 0.8, ensuring accurate interpretations .
• L1-Orthogonal Regularized GRU Decision Tree: This improved version introduces regularization in the GRU’s loss function, simplifying its decision boundaries. 이 모델은 GRU의 손실 함수에 정규화를 도입하여 결정 경계를 단순화합니다.
• Example: The model identified dominant rules involving moving averages for predicting upward or downward stock trends, achieving fidelity scores up to 0.97. 이동 평균을 포함한 주요 규칙을 통해 주식 상승 또는 하락 트렌드를 성공적으로 예측했습니다 .
진짜 0.97 인가???? Wenjun Wu, Yuechen Zhao, Yue Wang, and Xiuli Wang. 2020. Stock Price Forecasting and Rule Extraction Based on L1-Orthogonal Regularized GRU Decision Tree Interpretation Model.
https://www.researchgate.net/publication/343782731_Stock_Price_Forecasting_and_Rule_Extraction_Based_on_L1-Orthogonal_Regularized_GRU_Decision_Tree_Interpretation_Model
• Integrated Decision Tree Models:
Decision trees are directly embedded in complex architectures.
• Example: A decision tree was combined with textual and socioeconomic data to assess the market impact of terrorist attacks. Predictions were traceable through clear rules like:
“If the S&P 500 drops today and there have been multiple attacks in two days, predict a market drop”. 텍스트 및 사회경제 데이터를 사용하여 테러 공격의 시장 영향을 평가한 사례에서 “S&P 500이 오늘 하락하고 2일 동안 여러 공격이 발생하면 시장 하락을 예측”과 같은 규칙이 생성되었습니다
2) Rule-Based Modules
Rule-based modules derive decision-making logic through explicitly defined or algorithmically learned rules. Unlike decision trees, rule-based systems can incorporate external knowledge or linguistic frameworks like fuzzy logic.
Types of Rule-Based Modules
1. Expert-Initiated Rules: These systems rely on human expertise to define initial rules, often refined by algorithms.
2. Learned Rules: Algorithms independently derive rules from data, such as clustering or evolutionary techniques.
Applications in Financial Forecasting
• Mamdani-Type Fuzzy Rule Systems:
These models use linguistic variables (e.g., “low volatility”) and IF-THEN rules for transparent decision-making.
• Example: Subtractive clustering identified significant financial rules, balancing accuracy and interpretability. 퍼지 규칙을 적용하여 “1-4일 동안 가격이 낮으면 다음 거래일 가격이 낮을 가능성이 높음”과 같은 해석 가능한 결과를 도출했습니다 .
• Neuro-Fuzzy Systems:
Combines fuzzy logic with neural networks for robust predictions.
• Example: Neural Fuzzy Hammerstein-Wiener (NFHW) systems applied fuzzy rules to stock predictions. Rules like “If prices for days 1-4 are low, predict a low closing price” were directly interpretable .
• Type-2 Parsimonious Learning Machines (T2-PALM):
A neuro-fuzzy system that optimizes rule sets using evolutionary algorithms.
• Example: T2-PALM reduced rules for fluctuating stock indices while maintaining accuracy. Its rules involved weighted feature combinations for better interpretability .
• Hierarchical Belief Rule Base (HBRB-I):
Combines expert rules with machine learning to refine weights and decision structures.
• Example: HBRB-I used expert-defined rules for stock movement predictions and optimized their weights, ensuring transparency (Figure 6).
HBRB-I는 전문가가 정의한 규칙을 사용하여 주식 움직임을 예측하고, 가중치를 최적화하여 투명성을 보장했습니다 (Figure 6)
Advantages
• Rule-based modules are flexible and can integrate domain knowledge for specialized applications.
• They are ideal for scenarios requiring transparency and adherence to regulatory standards.
Comparison Between Decision Trees and Rule-Based Modules
Aspect)
Decision Trees vs Rule-Based Modules
Structure)
Hierarchical tree of decisions vs IF-THEN rules or linguistic variables
Transparency)
High, with clear decision paths vs High, particularly with expert-initiated rules
Flexibility)
Limited to tree structures vs More flexible, can incorporate fuzzy logic or expert rules
Applications)
Time series forecasting, feature importance ranking vs Neuro-fuzzy systems, hybrid rule-optimization models
5.3 Trends
The “Trends” section of interpretable models emphasizes methods for identifying and analyzing trends in financial time series data. These methods provide insights into long-term behaviors, seasonality, and patterns, enhancing interpretability by decomposing complex data into comprehensible components. This section introduces key techniques like trend extraction, decomposition models, and hybrid approaches.
1) Trend Extraction and Representation : Trend analysis involves isolating the underlying patterns in time series data that represent consistent directional movements over time. These trends provide interpretable insights into the factors driving market behaviors.
1. Hodrick-Prescott (HP) Filter:
• Separates a time series into trend (long-term component) and cyclical elements (short-term fluctuations).
• Application: HPFilter combined with RNN models has been used to predict macroeconomic indicators like GDP and unemployment rates. For example, Feuerriegel et al. [32] integrated HPFilter outputs into neural networks to improve prediction accuracy.
2. Moving Average Techniques:
• These methods smooth time series data to reveal underlying trends while reducing noise.
• Example: Moving average models were applied to detect growth patterns in stock prices, providing interpretable insights into periods of consistent increase or decrease.
• Visualization : Trends are often visualized using line graphs with trend components overlaid on the original data (e.g., Figure 7). This allows analysts to observe how deviations from the trend correspond to specific financial events or anomalies.
3) Decomposition Models
Decomposition models break down time series data into separate components such as trends, seasonality, and residuals. This process enables interpretable modeling by focusing on the influence of each component.
1. Additive Decomposition: Assumes the observed value is a sum of trend, seasonality, and residual components.
• Use Case: Applied in analyzing economic indicators, where linear trends dominate.
2. Multiplicative Decomposition: Assumes the observed value is a product of the trend, seasonality, and residuals.
• Example: Used in datasets with exponential growth, such as cryptocurrency prices or high-growth stocks.
3. Hybrid Models
• Hybrid Linear-Nonlinear Models: Combine linear models like ARIMA to capture trends and non-linear models like LSTMs to analyze residuals.
• Example: N-BEATS models have been enhanced with trend decomposition layers, achieving higher interpretability for stock price forecasting.
4) Trend-Enhanced Neural Networks
Neural networks can incorporate trend components to improve interpretability and accuracy:
• N-BEATS Architecture: 추세와 계절성 블록으로 분해하여 예측에 대한 기여도를 명확히 모델링 Decomposes input time series into trend and seasonality blocks, explicitly modeling their contributions to predictions.
• Example: Applied in financial forecasting, N-BEATS separates stock prices into long-term growth and periodic patterns, enabling clear interpretation of results (Figure 8).
• Attention Mechanisms for Trend Analysis: Attention layers are used to assign weights to specific time frames, highlighting periods that contribute most to observed trends.
• Use Case: Used in predicting market recovery periods after significant economic downturns.
해석 가능성의 평가 요소
1. 시뮬레이션 가능성
시뮬레이션 가능성은 모델 전체를 한눈에 이해할 수 있는 정도. 선형 모델이나 깊이가 제한된 결정 트리는 단순성을 통해 높은 점수를 얻는 반면, 어텐션 기반 구조나 그래프 신경망과 같은 복잡한 모델은 낮은 점수를 받을 가능성이 높습니다.
2. 분해 가능성
모델의 구성 요소(입력, 매개변수, 계산)가 각각 이해 가능한지 평가. 예를 들어:
• Decision trees decompose decisions into simple rules.
• Attention mechanisms provide clear weightings for features and time steps.
• Models relying on latent features (e.g., abstract embeddings) may struggle to meet this criterion unless the features themselves have an interpretable semantic basis. 잠재 특성을 사용하는 모델은 이러한 특성이 명확한 의미를 가지지 않을 경우 낮은 점수를 받을 수 있습니다
3. 알고리즘 투명성
학습 및 추론 과정의 명확성the clarity of the training and inference processes을 측정합니다.
선형 회귀와 결정 트리는 고유한 솔루션과 결정론적 출력unique solutions and deterministic outputs을 제공하여 높은 투명성을 가지지만,
딥러닝 모델은 확률적 최적화와 비결정적 구조stochastic optimization and non-deterministic architectures로 인해 투명성이 부족합니다.
평가시의 과제 Challenges in Evaluation
• Subjectivity: Simulatability often depends on the user's expertise and cognitive capacity. For example, a financial analyst may find trend analysis models intuitive, while a layperson may not. 금융 분석가는 추세 분석 모델을 직관적으로 이해할 수 있지만 일반 사용자는 그렇지 않을 수 있습니다
• Reliability of Interpretations: Complex models may produce explanations (e.g., attention weights) that appear interpretable but do not fully align with their internal logic. 그럴씨헤보일 뿐 This misalignment can mislead users into over-trusting model outputs.
해석 가능성 평가 기준
1. 맥락 감수성: 사용자 그룹(예: 금융 분석가와 데이터 과학자)에 맞춘 설명
2. 지역적 및 전역적 관점: 모델은 global insight(예: 전체 데이터셋에 대한 특성 중요도)과 특정 예측에 영향을 미친 요인을 보여주는 지역적 설명을 모두 제공해야 합니다.
3. 시각화 도구: 히트맵, 막대 차트, 결정 경로 등의 시각적 도구 활용
결론: 해석 가능한 모델에 대하여
해석 가능한 모델은 성능과 투명성 간의 균형을 유지하며, 금융 시계열 예측의 고유한 과제를 해결하기 위해 다양한 기법을 제공합니다. 표준화된 프레임워크를 통해 해석 가능성을 평가하면 AI 모델이 높은 정확성을 달성할 뿐만 아니라 신뢰와 책임성을 기반으로 한 의사결정 과정을 지원할 수 있습니다.
'time-series' 카테고리의 다른 글
| 시계열에서 변화된 지점 찾기 (0) | 2024.12.27 |
|---|---|
| Dynamic Time warping > Adjacency Matrix (2) | 2021.12.19 |
| Spice.ai - 개발자를 위한 Time Series AI 오픈소스 (0) | 2021.09.11 |
| ARIMA와 Google Trend 데이터를 활용한 이커머스 상품 가격 예측 (0) | 2021.06.20 |